Matplotlib 笔记
Matplotlib 笔记
基于 Matplotlib 版本 3.8.0
基本使用
基本使用
一般情况下, 调用 Matplot.pyplot 用于绘图, 并采通常采用别名 plt
并且 Matplotlib 还会配合 Numpy 使用
import numpy as np
import matplotlib.pyplot as plt

x = np.arange(0, 2 * np.pi, 0.1)
y = np.sin(x)

fig = plt.figure()
axe = fig.subplots(1, 1)
axe.plot(x, y)
画布元素

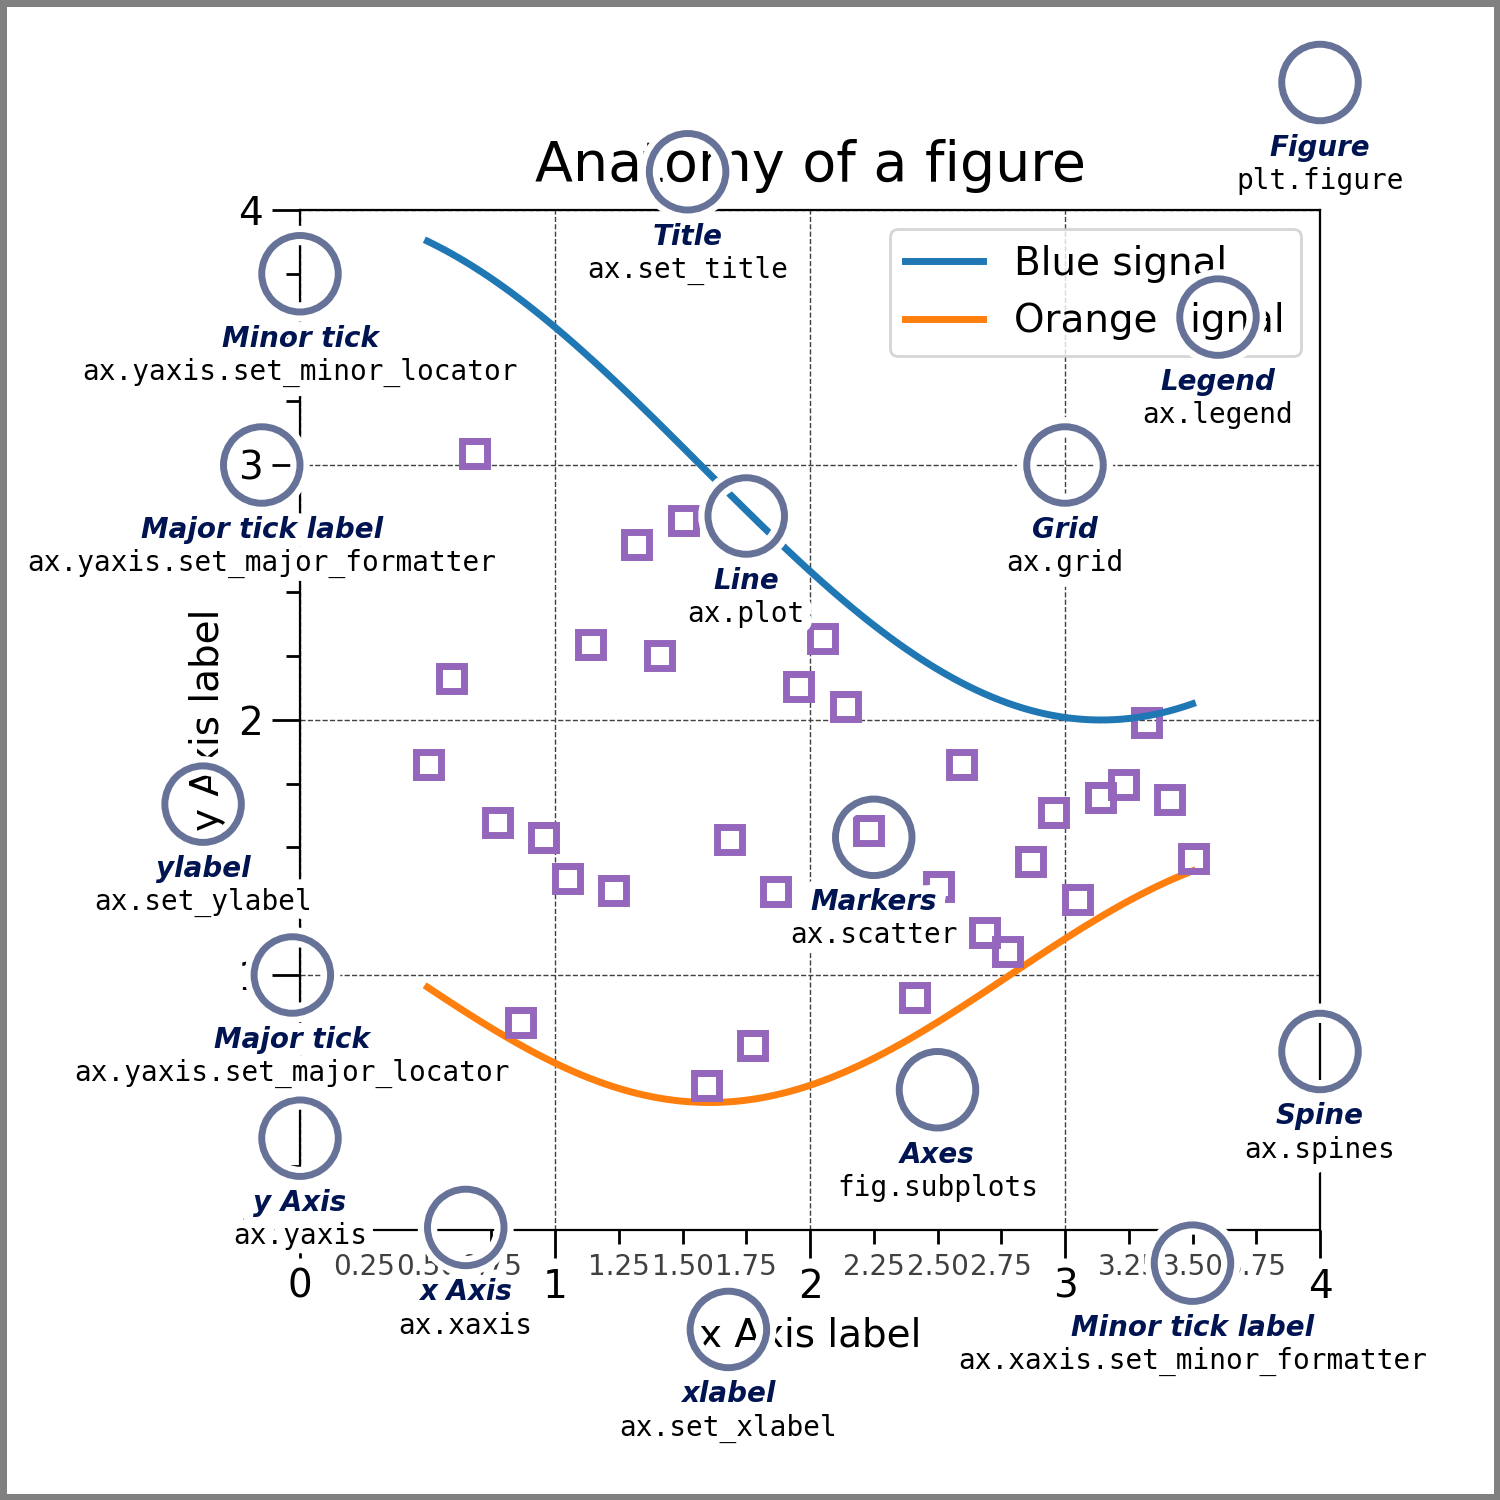
对于一张画布上, 共有如图所示的多个元素
| 类名 | 名称(非官方) | 创建/设置 |
|---|---|---|
Figure | 画布 | fig = plt.figure() |
Axe | 图像 | axes = fig.subplots(...) |
Line | 曲线 | axe.plot(x, y) |
Markers | 标记点 | axe.scatter(x, y, s) |
Axis | 坐标轴 | axis = axe.xaxis/yaxis |
Tick | 刻度 | axis.set_ticks() |
Grid | 网格 | axe.grid(...) |
Spine | plt.spine |
图像 Axe
基本操作
设置坐标轴名称
设置标题名称
设置图例
图形边距
Axes.margins()
图像背景颜色
Axes.patch.set_facecolor()
坐标轴 Axis
双坐标轴图
Axes.twinx/y()
设置轴比例
Axis.set_xscale(value, **kwargs)/set_yscale(value, **kwargs) 可以用于设置坐标轴刻度间隔的比例模式
- 参数
value为模式名称"linear"线性模式, 刻度间隔与刻度值成正比"log"对数模式, 刻度间隔与刻度两端值的比值成正比"symlog"对称对数模式"function"自定义, 见官方文档
- 参数
**kwargs根据不同的模式而改变, 见文档说明- eg.
log模式下, 有参数base设置底数,subs设置子刻度
- eg.
- 示例
设置横纵坐标轴比例 (图像比例)
Axes.set_aspect()
显示/关闭轴线
Axis.set_visible(b) 用于显示关闭轴线
当轴线不显示时, 包括轴标签, 刻度在内的元素都不会显示
- 参数
b为是否显示轴, 当为False时, 轴隐藏, 但图像边界spine不会隐藏
刻度 Tick
设置坐标轴刻度与标签
Axis.set_ticks(ticks, label = None, is_minor = False) 用于设置刻度与子刻度的位置以及刻度
- 参数
ticks为刻度值数组
传入空数组[]可以不显示 / 隐藏刻度 - 参数
label为刻度标签数组
通常情况数组长度必须与ticks相同, 或为None(自动生成)
传入空数组[]可以不显示 / 隐藏标签 - 参数
is_minor为是否设置子刻度, 默认设置刻度
设置刻度显示
Axis.set_tick_params(which, direction, labelsize, labelcolor, labelrotation) 用于设置刻度 (见文档), 及其标签的显示
该函数也可用于设置网格
- 参数
which为被设置的刻度, 可取值{'major', 'minor', 'both'} - 参数
direction为刻度方向, 可取值{'in', 'out', 'inout'} - 参数
labelsize为刻度标签大小 - 参数
labelcolor为刻度标签颜色 - 参数
labelrotation为刻度旋转角度
显示/关闭子刻度
Axe.minorticks_on/off() 可用于设置子刻度的开关
当调用 Axe.minorticks_on() 后, 所有子刻度线都将开启
当子刻度开启后, 还需要使用 Axis.set_ticks(..., minor = True) 设置才能显示子刻度
应最后调用此函数, 保证设置生效
获取刻度标签元素 (高级刻度显示)
Axis.get_ticklabels
示例 : 以 2 为底的对数坐标轴
注意, 通过set_xscale可以更简单达到示例效果, 此处仅用于演示
import matplotlib.pyplot as plt
import numpy as np

x = np.logspace(0, 10, 100, base = 2)
y = np.log2(x) ** 2

fig = plt.figure()
axe = fig.subplots()
axe.plot(x, y)

# 将刻度长度设为对数模式
axe.set_xscale('log')

# 默认为以 10 为底, 通过设置刻度位置, 改为以 2 为底
ticks = np.logspace(0, 10, 6, base = 2)

# 使用推导式快速生成刻度名称
axe.xaxis.set_ticks(
    ticks = ticks,
    labels = ['$2^{{{num:.1f}}}$'.format(num = np.log2(it))
     for it in ticks
     ])

# 使用推导式快速生成子刻度
axe.xaxis.set_ticks(ticks =
    [(ticks[it // 4 + 1] / 4) * (it % 4)
    for it in np.arange((ticks.size - 1) * 4)
    if it % 4 != 0
    ],
    # 传入空数组, 以隐藏子刻度标签
    labels = [],
    minor = True)

# 迭代刻度标签元素, 进行高级设置
for it in axe.xaxis.get_ticklabels(minor = False):
    # 通过标签的 Text 元素来设置标签样式
    it.set(rotation=45, ha="center", rotation_mode="anchor")

fig.savefig("matplotlib_log2tick.svg")
绘图结果
网格 Grid
显示网格
Axes.grid(visible = None, which = 'major', axis = 'both')
设置网格样式
Axis.set_tick_params(which, grid_color, grid_alpha, grid_linewidth, grid_linestyle)
边框 Spine
画布 Figure
基本操作
创建画布
fig = plt.figure(figsize = (6, 8), dpi = 100, facecolor = 'white', layout)
用于创建画布
- 参数
figsize为画布大小
使用元组(w, h)分别表示长与宽
对应设置fig.set_size_inches(w, h) - 参数
dpi为画布分辨率
默认情况下长度参数 (如画布大小) 对应的实际像素为 参数大小乘以分辨率
对应设置fig.set_dpi(val = 100) - 参数
facecolor为画布颜色 - 参数
layout为画布内的图像布局方式, 取值为{'constrained', 'compressed', 'tight', 'none', LayoutEngine, None}
详见基本布局
画布标题
fig.suptitle(t, size) 用于设置画布标题
- 参数
t标题文字 - 参数
size文字大小, 取值
输出画布
fig.savefig(fname) 保存画布
- 参数
fname为保存图片的名称, 根据名称后缀自动确定格式
支持.svg,.jpg,.png等格式
基本布局
设置布局方式
fig.set_layout_engine(layout=None, **kwargs)
用于设置画布基本布局引擎
- 参数
layout包含{'constrained', 'compressed', 'tight', 'none', LayoutEngine, None}- 默认情况下为
None, 此时不进行布局处理, 可能会出现图像重叠 constrained调整图像大小以防止图像间的元素重叠, 用于一般情况compressed与constrained算法相同, 但会移除图像间的多余空间, 用于网格图像tight调整图像参数以防止图像间的元素重叠
- 默认情况下为
- 参数
**kwargs为布局引擎设置, 具体见文档, 以下为常用的参数- 参数
h_pad子图像在长度方向的内边距 - 参数
w_pad子图像在宽度方向的内边距 - 参数
hspace子图像在长度方向的外边距 (tight模式无此参数) - 参数
wspace子图像在宽度方向的外边距 (tight模式无此参数)
- 参数
新建子图像
axes = fig.subplots(nrows = 1, ncols = 1, *, sharex = False, sharey = False)
创建子图像, 并对子图像进行简单布局
- 参数
nrows设置子图像行数 - 参数
ncols设置子图像列数 - 参数
sharex设置 x 轴在子图像之间是否共享 / 共享方式, 可选参数bool or {'none', 'all', 'row', 'col'} - 参数
sharey设置 y 轴在子图像之间是否共享 / 共享方式, 可选参数bool or {'none', 'all', 'row', 'col'}
添加子图像
axe = fig.add_subplot(nrows = 1, ncols = 1, index = 1, sharex = False, sharey = False, projection) 通过逐个添加的方式创建子图像, 该方法与fig.subplots冲突, 但可用于创建极坐标等图像
- 参数
nrows设置子图像总行数 - 参数
ncols设置子图像总列数 - 参数
index被设置的子图像索引 - 参数
sharex设置 x 轴在子图像之间是否共享 / 共享方式, 可选参数bool or {'none', 'all', 'row', 'col'} - 参数
sharey设置 y 轴在子图像之间是否共享 / 共享方式, 可选参数bool or {'none', 'all', 'row', 'col'} - 参数
projection为子图像类别, 如极坐标图, 可选择参数{None, 'aitoff', 'hammer', 'lambert', 'mollweide', 'polar', 'rectilinear', '3d', str}polar表示极坐标图rectilinear表示二维空间坐标图3d表示三维空间坐标图 (详见三维图像绘制)- 其余图像主要用于地理
示例 : 九宫格图
import matplotlib.pyplot as plt
import numpy as np

# 子图像紧贴时, 最好使用大图幅
fig = plt.figure(figsize=(9, 9))
# 将内外边距均设置为 0, 实现子图像紧贴的效果
# 使用此语句可达到同样的效果 fig.set_layout_engine('tight', w_pad = 0, h_pad = 0)
fig.set_layout_engine('compressed', w_pad = 0, h_pad = 0, wspace = 0, hspace = 0)
fig.suptitle('$y=e^{st}$', size = 20)
# 设置子图像的 x 轴按 列共享, y 轴按行共享
axes = fig.subplots(3, 3, sharex = 'col', sharey = 'row')

t = np.arange(-10, 10, 0.01)
for i in range(3):
    for j in range(3):
        # 通过断言保持类型被编辑器识别
        axe : plt.Axes = axes[i, j]
        axe.plot(t, np.exp((0.6 * (1j * (i - 2)) + 0.1 * (j)) * t))
        # 通过 transform = axe.transAxes 设置, 使用相对坐标确定文本位置
        axe.text(0.2, 0.8, 's = {0} + {1}i'.format(0.1 * j, 0.6 * (i - 2)),
                 transform = axe.transAxes)

        # 仅保留左下角的刻度
        if i != 2:
            axe.xaxis.set_visible(False)
        if j != 0:
            axe.yaxis.set_visible(False)

# 输出图像
fig.savefig('matplotlib_3x3subplot.svg')
输出图形
栅格布局 GridSpec
创建栅格
gs = fig.add_gridspec(nrows, ncols, wspace, hspace)
将画布根据栅格均分为几块区域
- 参数
nrows栅格行数 - 参数
rcols栅格列数 - 参数
wspace栅格在宽度方向的外边距
注意由于constrained布局还有内边距, 因此要实现相连图像的效果只能使用tight模式或不采用布局处理 - 参数
hspace栅格在长度方向的外边距
栅格划分比例设置
gs.set_height/width_ratios([ratios]) 设置栅格各行/列的划分长度
- 参数
ratios为一个数组, 表示各个栅格的相对长度, 将根据栅格占总长的比例划分实际长度
直接创建子图像
axes = fig.add_subplot([gs], projection)
在指定几个栅格上创建子图像
- 参数
gs为栅格数组中的元素, 可通过选择器选择gs[a, b]选择栅格 (a, b)gs[a:, b:c]选择 a 到下边界上所有行, 与 b 到 c - 1 列上的栅格
- 参数
projection为子图像类别, 如极坐标图, 见新建子图像说明
创建子栅格
sub_gs = gs[...]/sub_gs.subgridspec(nrows, ncols, wspace, hspace)
在指定几个栅格 (子栅格) 上创建子栅格
- 参数
nrows子栅格行数 - 参数
rcols子栅格列数 - 参数
wspace子栅格在宽度方向的外边距
注意由于constrained布局还有内边距, 因此要实现相连图像的效果只能使用tight模式或不采用布局处理 - 参数
hspace子栅格在长度方向的外边距
子栅格划分比例设置
gs.set_height/width_ratios([ratios]) 设置栅格各行/列的划分长度
- 参数
ratios为一个数组, 表示各个栅格的相对长度, 将根据栅格占总长的比例划分实际长度
由子栅格创建子图像
axes = sub_gs.subplots(sharex, sharey)
在各个子栅格上创建子图像
子栅格上不能创建多个子图像, 而是将根据子栅格的划分一格自动放置一个子图像
- 参数
sharex设置 x 轴在子图像之间是否共享 / 共享方式, 可选参数bool or {'none', 'all', 'row', 'col'} - 参数
sharey设置 y 轴在子图像之间是否共享 / 共享方式, 可选参数bool or {'none', 'all', 'row', 'col'}
示例 : 复杂图像
import matplotlib.pyplot as plt
import numpy as np

fig = plt.figure(figsize=(4, 4))
# 要保证 Ax3 与 Ax4 无间隔, 需要使用 tight 模式
fig.set_layout_engine('tight')

# 创建一个 3X3 的栅格
gs = fig.add_gridspec(3, 3)
# 设置栅格高度比例为 2:2:1
gs.set_height_ratios([2, 2, 1])

t = np.arange(0, 2 * np.pi, 0.1)

# 通过将栅格作为参数传入 fig.add_subplot 的方式在特定栅格上创建子图像
# ax1 占用 (0, 0)(0, 1)(1, 0)(1, 1) 四个栅格
# 通过设置 projection, ax1 为极坐标图
ax1 = fig.add_subplot(gs[0 : 2, 0 : 2], projection = 'polar')
ax1.set_title('Ax1')
ax1.plot(t, 1 - np.cos(t))

# ax2 占用 (0, 2)(1, 2) 两个个栅格
# 注意 0:2 仅能选取到 0, 1 两个元素 (不包含末尾)
ax2 = fig.add_subplot(gs[0 : 2, -1])
ax2.set_title('Ax2')
ax2.plot(t, np.exp(t))

# 在 (2, 0)(2, 1)(2, 2) 处的栅格的基础上建立 1X2 的子栅格
# 子栅格的间距依然可以设置
sub_gs = gs[-1, 0:].subgridspec(1, 2, wspace = 0)
# 子栅格上的子图像无法划分, 但依然可以设置共享坐标轴
axes = sub_gs.subplots(sharey = 'row')

axes[0].set_title('Ax3')
axes[0].plot(t, np.sin(t))

axes[1].set_title('Ax4')
axes[1].plot(t - np.pi, np.cos(t - np.pi))
axes[1].yaxis.set_visible(False)

fig.savefig("matplotlib_complex_layout.svg")
输出图形
标记 Label
图例
文字 text
箭头 arrow
直线 axline
图像
统计直方图
离散折线图
高级绘图
特殊图像绘制
三维图像绘制
创建三维图像
推荐的三维图像创建代码如下
import matplotlib.pyplot as plt
from mpl_toolkits.mplot3d import Axes3D

# 方法一
fig = plt.figure()
axe: Axes3D = fig.add_subplot(1, 1, 1, projection = '3d') # type: ignore

# 方法二
fig = plt.figure()
axe = Axes3D(fig, auto_add_to_figure=False)
fig.add_axes(axe)

# 建议在终端中运行, 以实现与三维图像的互动
plt.show()
创建三维多边形
https://stackoverflow.com/questions/4622057/plotting-3d-polygons
动画绘制
参考自文章
使用类 matplotlib.animation.FuncAnimation 实现动画效果
类构造函数主要参数
fig- 类型
Figure - 用于绘制动画的画布
- 类型
func- 类型
callable(frame) - 在回调函数
func中绘制每一帧, 其中参数frame为当前动画帧数
- 类型
frames- 类型
int - 动画的总帧数
- 类型
interval- 类型
int - 每一帧持续时间 (单位毫秒)
- 类型
主要成员函数
FuncAnimation.save(filename)- 图像保存函数
- 参数
filename为图像的保存路径
使用注意
- 图像绘制函数
func在绘制时- 绘制前调用
Axe.clear()函数, 清除上一帧的图像 - 调用
Axe.set_xlim与Axe.set_ylim使图像显示区域保持一致
- 绘制前调用
使用示例
import numpy as np
import matplotlib.pyplot as plt
from matplotlib.animation import FuncAnimation

t = np.arange(0, 2 * np.pi, 0.05)
y = np.sin(t)

fig, axe = plt.subplots(1, 1, figsize = (3, 3))

def update(frame):
    axe.clear()
    axe.set_xlim([0, 2 * np.pi])
    axe.set_ylim([-1, 1])

    end = int(t.size * int(frame) / 80)
    axe.plot(t[0 : end], y[0 : end])

anime = FuncAnimation(
    fig = fig,
    func = update,
    frames = 80,
    interval = 50
)

anime.save('test.gif')
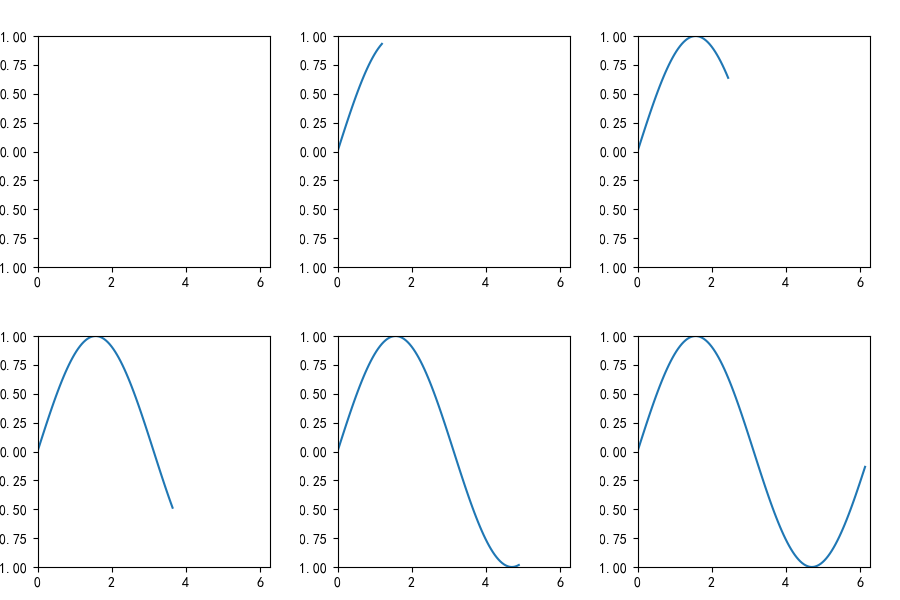
matplotlib_funcanimation 以上代码可生成动画

杂项
中文显示
参考文章 https://zhuanlan.zhihu.com/p/52779214?from_voters_page=true
- 打开模块资源文件夹
.../anaconda3/envs/[python 环境名]/Lib/site-packages/matplotlib/mpl-data(或miniconda3) - 将中文黑体如思源黑体并安装或放置在特定字体文件夹 (对后缀无要求, 最好使用新字体)
- 打开模块设置文件夹
C:\用户\[用户名]\.matplotlib\matplotlibrc(Windows)$HOME/.config/matplotlib/matplotlibrc(Linux)
- 打开模块设置文件夹下的
fontlist-v330.json, 并在键ttflist下的数组中添加如下方代码所示的结构体- 将键
fname的值改为字体路径, Windows 下安装字体后一般位于文件夹C:\\Windows\\Fonts - 将键
name的值改为字体名称, 一般输入文件名即可
- 将键
- 将模块资源文件夹下的
matplotlibrc文件复制到模块设置文件夹并打开复制后的文件, 进行以下修改font.family删除该选项前的#font.sans-serif删除该选项前的#, 在冒号后添加之前添加结构体中键name的值
结构体示例
{
    "fname": "Path\\to\\font\\XXX.ttf",
    "name": "XXX",
    "style": "normal",
    "variant": "normal",
    "weight": 400,
    "stretch": "normal",
    "size": "scalable",
    "__class__": "FontEntry"
}
简单 Latex 显示
Matplotlib 可以绘制简单的行内 Latex (不支持宏包)
使用时注意
- 需要转换的部分使用
$...$包括 - 由于反斜杠
\也是字符串转义符, 因此需要使用双反斜杠, 或使用r'...', 不对字符串转义 - 为了更好的分式显示效果, 最好使用
\dfrac表示分式 - 在配合
str.format使用时,{...}应改为{{...}}
使用示例
fig = plt.figure()

fig.text(0, 0, '二次方程求根公式: $x=\\dfrac{-b\\sqrt{b^2-4ac}}{2a}$')
fig.text(0, 0, '$\\dfrac{{{num}}}{{x}}$'.format(num = 1))